If a system issued 100 queue tickets and 82 ended in service, it is tempting to say there was an 18% abandonment rate. That shortcut would only be correct if all the other 18 tickets represented people who joined the queue, waited and left before service began. In an in-person operation, that can almost never be assumed without classifying the outcomes.
The abandonment rate needs to measure a specific event: the person actually joined the queue and left while waiting, before service began. A canceled ticket, a duplicate record, a system test, a transfer, a person not found after being called and someone who decided not to join the queue can represent different situations. Mixing them produces a simple number, but one that is not reliable enough for decisions about staffing, capacity or changes to the service process.
What the abandonment rate should measure
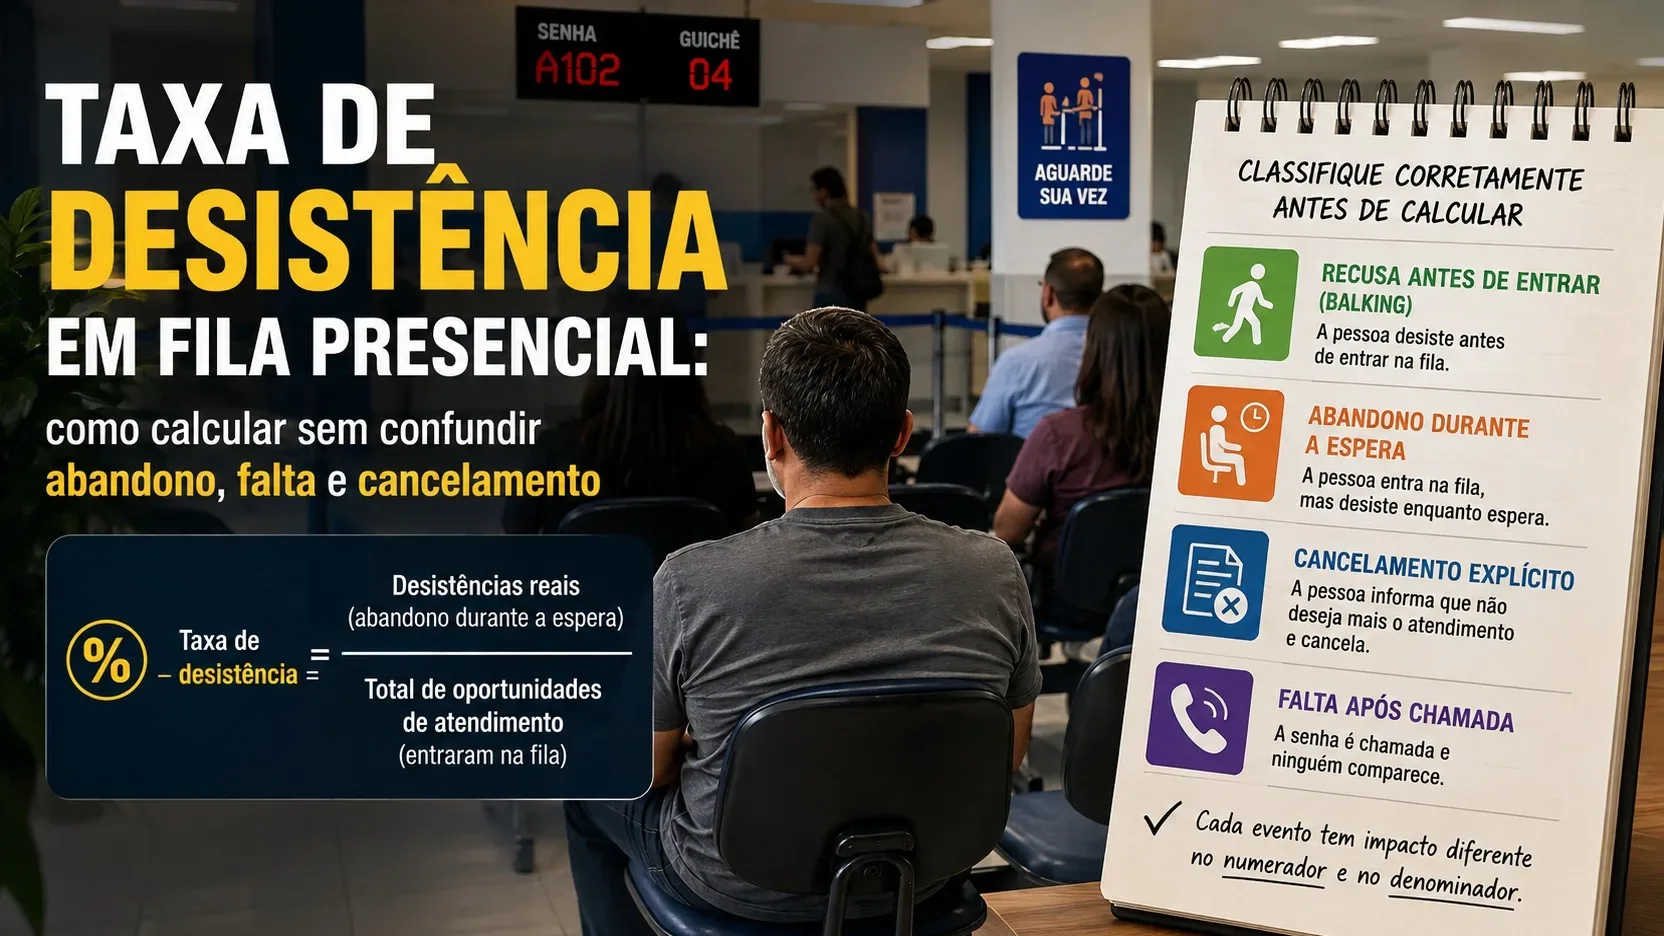
In queueing literature, there is a classic distinction between balking and reneging. Balking is the refusal to enter the queue; reneging is leaving after the person has already joined and begun waiting. For an in-person queue abandonment metric, the second behavior is the closest to what the indicator is intended to measure as abandonment during the wait.
A useful operational definition is: abandonment rate (%) = confirmed abandonments during the wait ÷ valid queue entries × 100.
The decisive point lies in the two expressions in the formula. “Confirmed abandonments” requires a classification criterion. “Valid queue entries” requires the denominator to represent people or service journeys that actually became part of that queue, excluding tests, duplicates and technical records that do not correspond to real demand.
Why tickets issued minus tickets served does not equal abandonment
The difference between tickets issued and tickets served measures, at most, how many entries did not end in service within that reporting window. By itself, it does not reveal the reason.
Consider a hypothetical example with 100 valid entries, all already closed. The system records 82 completed services, 8 confirmed abandonments during the wait, 4 explicit cancellations and 6 no-shows after being called. If management calculates 100 minus 82, it gets 18 unserved cases and may call that an 18% abandonment rate. But only 8 cases were actually classified as abandonment during the wait. With a denominator of 100 valid entries, the abandonment rate is 8%.
The other 10 cases remain relevant. They simply answer different questions. An explicit cancellation may reveal a change of intention, a triage error or resolution through another channel. A no-show after being called may mean the person left, did not hear the call, there was an operational error or the status was used as a generic way to close the ticket. Adding everything under the label “abandonment” erases those differences and makes it harder to correct the real cause.
The numerator: what counts as abandonment
The numerator should contain only journeys that meet the definition agreed by the operation. Under a simple rule, the person must have joined the queue and service must not yet have started when the abandonment occurs.
Ideally, the record is explicit. There may be an “abandoned” button, a closure recorded by reception after confirmation, an event in the queue application or another mechanism that identifies the departure. The less observable the event is, the more caution is needed before applying the label.
A ticket called with no response, for example, does not by itself prove abandonment. The person may have stepped away for a few minutes, failed to hear the display or announcement, been elsewhere in the facility or been called incorrectly. If the operation wants to convert a no-show after a call into abandonment, it needs an objective protocol, such as a number of repeat calls, the interval between calls and a defined closing condition. Until that protocol produces enough evidence, it is safer to keep “no-show after call” as a separate outcome.
Explicit cancellation also deserves its own category. If the person says they no longer want the service and the organization records that act, the data is more precise than inferring abandonment. Management can track cancellation and abandonment side by side and then investigate whether their causes overlap.
The denominator: who actually joined the queue
To answer “what share of the people who joined the queue abandoned the wait?”, the denominator should represent valid entries to that queue. This includes the different outcomes that may occur after entry, because they all belong to the same initial population.
In practice, the denominator should exclude test tickets, duplicates, records created by mistake and technical events that do not represent a new person or a new service journey. Transfers between counters or queues require a clear rule so that the same journey is not counted twice.
There is another important precaution: the reporting window needs to be closed. If the report is calculated at 5 p.m. while people are still waiting, those journeys do not yet have an outcome. A robust solution is to work with entry cohorts: select everyone who entered during a given period and calculate the rate once all journeys in that cohort have been closed. In a real-time dashboard, the rate can be shown as provisional, but the number of still-open cases needs to be displayed separately to avoid false precision.
Four situations that should not be mixed
Refusal before joining the queue
Someone who sees the queue and decides not to participate has not abandoned a wait that never started. In queueing theory, this behavior is called balking. In a queue based only on issued tickets, it may be invisible because no ticket was ever issued.
If this behavior matters to the business, it requires another data source, such as footfall counting at the entrance, reception staff recording the interaction or logging people who ask about the estimated wait and decide not to take a ticket. The indicator should have a different name because its denominator is also different: people who reached the decision point, not people who actually joined the queue.
Abandonment during the wait
This is the central event in the abandonment rate. The person joined the queue, remained waiting and left before service began. The time of abandonment is also useful: knowing whether departure occurs after 5, 20 or 60 minutes helps identify the range in which waiting stops being tolerated in that context.
Explicit cancellation
Cancellation is a known closure. The person states that they no longer wish to proceed, or the operation records a specific reason that makes service unnecessary. Keeping it separate helps determine whether the issue is waiting time, a change in need, documentation, referral or another factor.
No-show after being called
A no-show after a call is a signal, not necessarily a cause. The system knows that the ticket was called and the person did not present themselves at that moment. Without additional confirmation, it does not know why. Automatically treating that no-show as abandonment can inflate the rate and hide problems with audio, displays, wayfinding, movement through the space or incorrect ticket closure.
A minimum data model for the queue
The quality of the indicator depends more on the events recorded than on the formula. For each journey, the system should be able to reconstruct at least entry into the queue, the first call, the start of service when it occurs, closure and the final outcome. Date, time, location, service and queue should also be associated with the journey so the data can be analyzed by context.
The outcome field should be limited to clear categories that the team understands in the same way. If “abandoned”, “did not show”, “canceled” and “operational error” mean different things to different staff members, the dashboard may look precise but will not be comparable across shifts or locations.
It is equally important to prevent a service that has already started from being closed as an abandonment. After service begins, a customer leaving may require another concept, such as service interruption. Mixing different stages makes it impossible to know where in the journey the loss occurred.
How to reconcile the numbers before publishing the rate
A good audit starts by checking whether the outcomes account for the observed population. For a cohort that is already closed, the number of valid entries should be compatible with the sum of served cases, confirmed abandonments, explicit cancellations, no-shows after calls and any other valid outcomes defined by the operation.
If the total does not reconcile, there are open records, duplicates, mishandled transfers or missing closures. The rate should not be used to compare performance until that difference is understood.
It is also worth testing the time sequence. An abandonment cannot have a timestamp earlier than entry. Service cannot begin after a final closure. A ticket marked “did not show” should not simultaneously appear as service started. Automated consistency rules reduce errors that would be difficult to detect by looking only at the final percentage.
The TCU warning about queue data without a reliable procedure
The importance of this governance appears concretely in the audit by the Tribunal de Contas da União (TCU), Brazil’s Federal Court of Accounts, on service provided by the Defensoria Pública da União, decided in Acórdão 956/2025-Plenário. The TCU treated waiting time and abandonment rate as relevant indicators of in-person service, but it also recorded a lack of reliability in the data when the queue management system was not used properly.
Among other problems, the audit identified distortions associated with the failure to correctly close services in the system. The result is a lesson that applies beyond the public sector: having software that issues queue tickets is not enough. If journey states are not closed consistently, the database can produce absurd waiting times and abandonment rates that appear objective but actually reflect procedural error.
The TCU itself recommended monitoring every stage of service, including waiting time and abandonment rate. In public services, Lei 13.460/2017 also includes expected waiting time among the quality standards communicated to users and requires continuous evaluation of service quality. The law does not provide a formula for abandonment; the operational definition still depends on a stable and auditable data classification.
How to compare time slots, locations or professionals without distortion
Once the definition is stable, always use the same numerator and the same denominator in comparisons. If one location counts a no-show after a call as abandonment and another does not, the ranking measures a difference in rules, not necessarily a difference in the user experience.
Grouping by time should also follow the moment of queue entry. That way, all journeys that began between 10 a.m. and 11 a.m. belong to the same cohort, even if some only end after 11 a.m. Grouping by closure time mixes people who arrived under different conditions and can shift the apparent problem into another time band.
When consolidating several groups, add the abandonments and add the entries before calculating the overall rate. Avoid taking a simple average of each group’s rates when the denominators differ. A queue with 100 entries has a different operational weight from one with 10.
The abandonment rate should not stand alone
A low rate can coexist with a poor wait if people have no alternative, and a high rate may be concentrated in a single service or time slot. Interpretation therefore improves when the indicator is read together with waiting time.
There is another important effect: looking only at the waiting time of people who were served can hide those who abandoned. If the most impatient customers leave before reaching the counter, the average among those who stayed may look reasonable even with meaningful loss in the queue. Whenever possible, track time to service and time to abandonment separately.
Median and waiting-time percentiles also help reveal long tails that the average hides. The goal is not to accumulate indicators, but to find out whether abandonment increases within a particular waiting-time range, service, time slot, location or staffing configuration.
A practical rule for implementing the metric
First, write the definition in one sentence that any staff member can apply: “abandonment is the confirmed departure of someone who has already joined the queue and has not yet started service”. Then configure separate outcomes for abandonment, cancellation and no-show after call. Next, remove from the denominator tests, duplicates and technical movements that are not new real entries.
Run the first measurement on a small cohort that is already closed. Reconcile the total entries with all outcomes. Review samples of records and verify that the timestamps make sense. Only then expand to daily and weekly dashboards and comparisons across locations.
If the operation still cannot distinguish the outcomes, the indicator should acknowledge that limitation. It is better to publish “unserved after entry” as a broad, temporary metric than to call everything abandonment and make capacity decisions from a number with the wrong meaning.
The indicator becomes useful when every loss has a name
The in-person queue abandonment rate is not “everything that did not become a service”. It is the share of valid entries that ended in confirmed abandonment during the wait, according to a clear operational rule.
Separating refusal before entry, abandonment during the wait, explicit cancellation and no-show after call turns a generic balance of queue tickets into management information. This allows the manager to determine whether the priority is reducing waiting time, improving the calling process, correcting triage, reviewing outcome records or investigating why people are canceling. The formula is short; reliability comes from the classification and procedures that feed the numerator and denominator.