
If the space holds 200 people and the list has 237 names, a fixed breakdown percentage seems to offer a quick answer. The problem is that small changes in this hypothesis completely alter the risk: with 15% absence, the count still shows around 201 people; at 20%, it drops to about 190. The decision shouldn't depend on choosing the percentage that produces the most comfortable number.
The safest way to design presence is to separate different stages of the guest funnel. Refusal is not the same thing as pending. Pending is not absence. And no-show is a later event: it happens when someone confirmed that they would go and, even so, doesn't show up.
The “break” of the list mixes different phenomena
In the wedding market, “break” is often used as a shortcut for the difference between the number of guests and the number that actually shows up. But this shortcut can hide different denominators.
A specialized Brazilian source, Constance Zahn, publishes breakage estimates that change depending on the origin of the guests, displacement and type of wedding. The page itself also separates the breakdown of the confirmed list. In other words, even when professionals use percentages, they are not necessarily measuring the same step.
Data published by RSVPify, based on marriages registered on the platform itself, found a historical average of 83% acceptance. The Knot gathers references and professional opinions across a wider range for positive RSVP and highlights that location, season and other factors influence the result. These references are helpful as context, but are not a universal table for any Brazilian wedding.
The gain is in changing the question “what is the percentage of absences?” by “what stage is each person at and what uncertainty still remains to be resolved?”.
Count people, not invitations
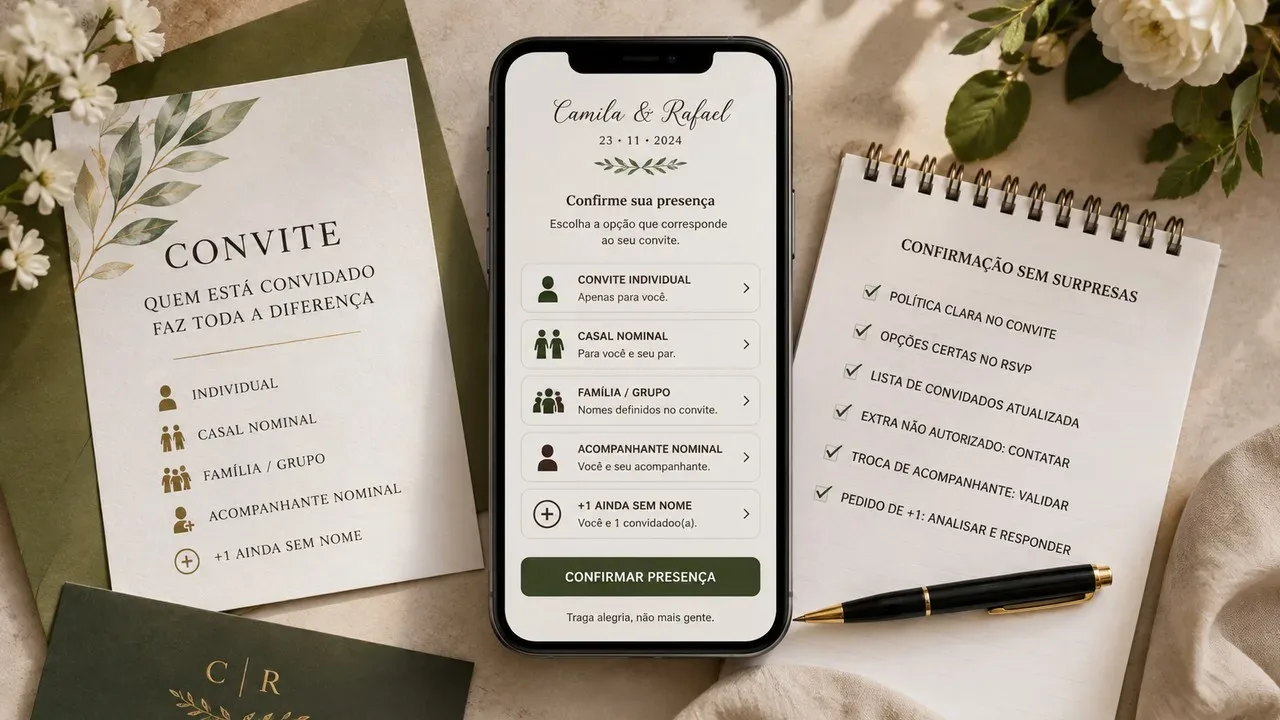
Before calculating anything, transform the list into a number of people. An invitation can represent a person, a couple, a family or someone with a companion. For capacity, buffet and seating, what matters is how many people can attend.
RSVP tools like iCasei already reflect this need by allowing you to register companions, age groups and total number of people confirmed and people who will not attend. Even in a simple spreadsheet, it is worth preserving this logic.
Guests are all people actually invited.
Confirmed are the people who answered yes.
Refusals are people who answered no.
Pending are people who have not yet given a definitive answer.
No-shows are just people who were among those confirmed and don't show up on the day.
This separation solves a common error: applying an absence fee to the entire list and then discounting again those who refused or did not respond. This mixes phases and can produce an overly optimistic projection.
Use two calculations before looking up any percentages
The first useful number is the acceptance rate among those who have already responded. It can be calculated like this: confirmed divided by confirmed plus refusals. The pending ones are outside this denominator because they are not yet a positive or negative answer.
The second number is the ceiling for still possible attendance: confirmed plus all pending. This ceiling is not a prediction; it serves to measure capacity risk.
Imagine 237 guests for a venue with a contracted capacity of 200. So far, 170 have confirmed, 32 have declined and 35 are pending. The acceptance rate among those who responded is approximately 84%. If the pending candidates exactly repeated the behavior of the respondents, there would be around 29 or 30 new acceptances and the total number of confirmed cases would be practically 200.
But the most important point comes before this estimate: the still possible ceiling is 205, because 170 have already said yes and 35 can still say yes. While this backlog exists, sending new invitations can create overbooking even if the historical average of the event seems comfortable.
Why “inviting 20% more” can go wrong
The phrase seems intuitive: if there is usually 20% missing, just invite 20% beyond capacity. Mathematics doesn't work that way as a guarantee.
If the capacity is 100 and you invite 120 people, it is enough for 83.3% of them to show up to fill all the seats. If attendance reaches 85%, there will be 102 people. With 90%, there will be 108. Therefore, “20% more” only works if the real attendance rate stays
low enough - and this is precisely the variable you don't know yet.
The risk increases when the list is made up of people very close to you, local guests, family groups that usually decide together or an event that is especially easy to access. The opposite can also happen in weddings that require travel, accommodation or higher costs for the guest. Specialized sources treat these factors differently precisely because they change the probability of acceptance.
When exceeding physical, contractual or budgetary capacity is not acceptable, the prudent strategy is not to rely on a future percentage to justify invitations that already place the event above the limit. If there is a second round of invitations, it is more manageable when it occurs after actual refusals, not before them.
Transform uncertainty into scenarios
Instead of adopting a single rate, take three readings. The percentages used in each scenario must be explicit hypotheses, not “market truths”.
Pressure scenario
Here you test what happens if attendance is higher than expected. For capacity, it is the most important scenario. Consider few or no no-shows and a high acceptance rate among outstanding ones. If this scenario exceeds the space limit, there is still a real risk of overcrowding.
Central scene
Use the behavior that already appears in your own list, preferably by comparable groups. If 84% of respondents have already said yes, this may be a starting point, but not a certainty. Adjust when responders are very different from first responders.
Time off scenario
Here you test a lower acceptance rate among those pending and some absence among those confirmed. It helps to understand the lower attendance range, but should not be used to release invitations when the pressure scenario still exceeds capacity.
The goal is not to figure out which scenario “gets it right” in advance. It's about seeing the range of plausible outcomes and making decisions that remain safe even if the marriage falls at the full end of that range.
Segment the list when the guests are very different
A general average can hide important differences. If half the list lives in the same city and the other half needs to travel, projecting everyone with the same rate tends to lose information.
Create groups that really change the chance of attendance. Local versus travel is an example. Very close family versus more distant relationships may be another. It may also make sense to separate guests who depend on accommodation, groups with children or people who are still waiting for relevant logistical issues.
It is not necessary to multiply categories until the spreadsheet becomes impossible. Only target when there is a concrete reason to expect different behavior.
The logic is the same within each group: count confirmed, rejected and pending; observe the acceptance rate among those who responded; design the pendants by scenario; then add the groups.
No-show is a discount on confirmed guests, not on guests
This difference is central. The Knot defines a no-show as the person who answered yes and didn't show up and cites professionals who use somewhere around 3% to 5% as a reference. Constance Zahn's Brazilian page mentions that there may be a small break also regarding confirmed, with another reference range. These are professional heuristics, not guarantees.
Therefore, the no-show must be included at the end of the account. First you estimate how many people will confirm. Only then does it test a margin of absence among those confirmed.
It is also not wise to rely on no-shows to fit into the space. The absence of a confirmed person is often unforeseen. If 102 people are confirmed for a site of 100, expecting two to be missing doesn't make 102 a safe number.
For buffets and consumption, there may be some flexibility depending on the supplier's contract and operation. This decision must be made with the person providing the service, because final quantity, tolerance and charging rules vary. Projection helps talk to data; does not replace the contracted conditions.
A complete example with a capacity of 200
Return to the case of 237 guests, 170 confirmed, 32 refused and 35 pending. The first reading is operational: there are already 170 committed presences and there are still 35 open possibilities.
In the pressure scenario, imagine that almost all pending requests are accepted and do not count on absences among those confirmed. The total could exceed 200. Therefore, no extra invitations should be released based solely on the idea that “someone is always missing”.
In the central scenario, you can use the acceptance rate observed among the 202 respondents as a provisional reference. It is close to 84%. Applied to the 35 pending, it would bring the total potential number of confirmations to close to 200. It is still a tight scenario, with little room for poorly registered companions or late changes.
In the off-duty scenario, a larger portion of those pending would refuse and some confirmed could cancel. The final number would drop. This is possible, but it is not the scenario that should authorize an irreversible decision to exceed capacity.
The example shows why the projection gets better as the RSVP progresses. With each refusal, the ceiling falls. With each confirmation, uncertainty becomes a commitment. And the number of pending cases decreases until the decision can be made with much less stake.
Contracted capacity, confirmed and margin are not the same thing
With capacity for 100 people and 90 confirmed guests, there is an objective space of ten seats. If there are still 15 pending, however, the gap is not guaranteed: the possible ceiling is 105.
With 98 confirmed and only two pending, the event is practically at its limit. Even if a market reference suggests no-shows, the pressure scenario remains 100.
With 103 confirmed for capacity 100, the problem is no longer statistical. It is operational. The couple needs to reduce, renegotiate or expand available capacity; Expecting three guests to be absent is not a contingency plan.
This layered reading replaces the old mental “average break” table. The decisive number changes depending on the stage of the RSVP.
Update projection as RSVP progresses
At first, work with wide intervals and give greater weight to the pressure scenario. There is little proprietary information and a lot of uncertainty.
Halfway through the confirmation period, switch to real answers. Calculate the acceptance rate among those who responded and observe whether it changes by group. RSVP systems can update totals of confirmed, declined and companions in real time; an updated spreadsheet with discipline produces the same decision structure.
Towards the deadline, stop treating pending as a permanent status. Actively follow up with those who didn’t respond. The goal is to convert backlogs into yes or no before sending the final number to suppliers.
After closing, the main base stops being the original list and becomes the total number of confirmed people. From then on, any no-show adjustments must be conservative, explicit and compatible with the operation of the venue and buffet.
A simple routine is to record, with each update, four numbers: total guests, confirmed, refusals and pending. Alongside, keep the ceiling possible and two or three presence scenarios. When the ceiling no longer threatens capacity and the pendants fall, the need to “guess the break” diminishes.
The rule of thumb is not to use a rate you haven't already observed as a license to fill
Breakage percentages are useful as an external reference, especially at the beginning of planning. They help to set up scenarios and test budgets. The mistake is to turn them into a promise that a certain number of people will be absent.
To decide how many places to hire or whether it is possible to call someone else, separate refusals, pending and no-shows; count people; use your own answer pattern; segment groups when there are real differences; and maintain a pressure scenario that does not depend on future absences to function.
In the end, the best projection is not the one that chooses a perfect percentage. It's the one that becomes progressively less uncertain as the RSVP progresses - and that remains secure even if more people say yes than you expected.